More projects in this category
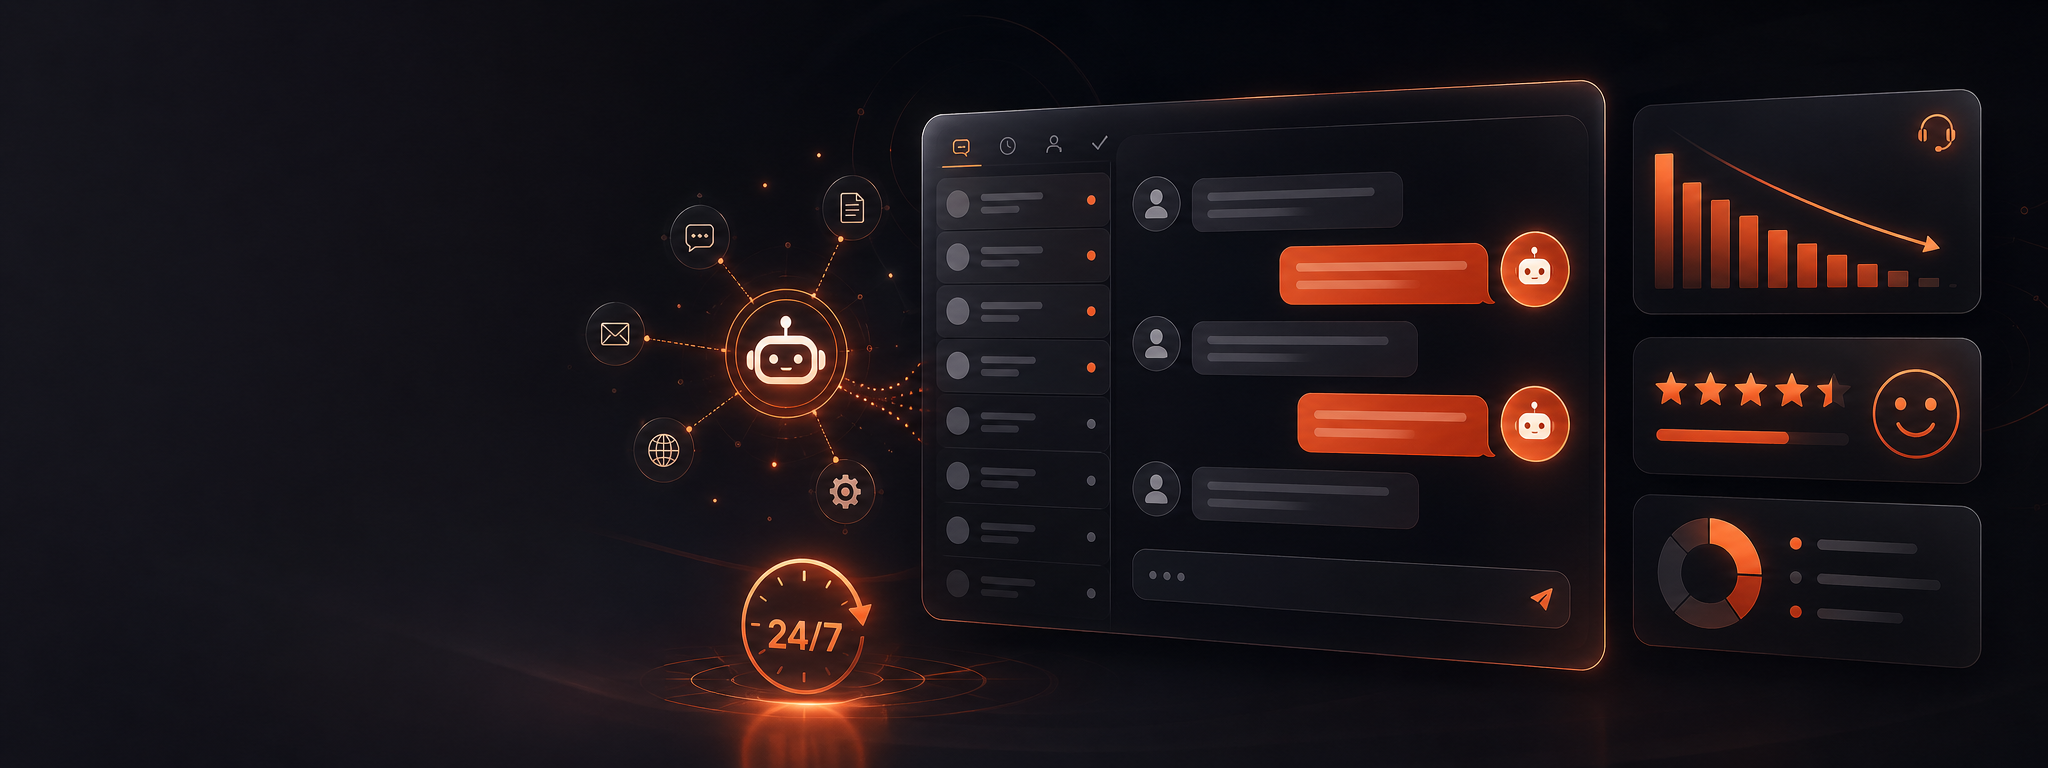
Personal LLM Deployment
Employees get instant answers from company knowledge. Research time reduced 75%.
View Project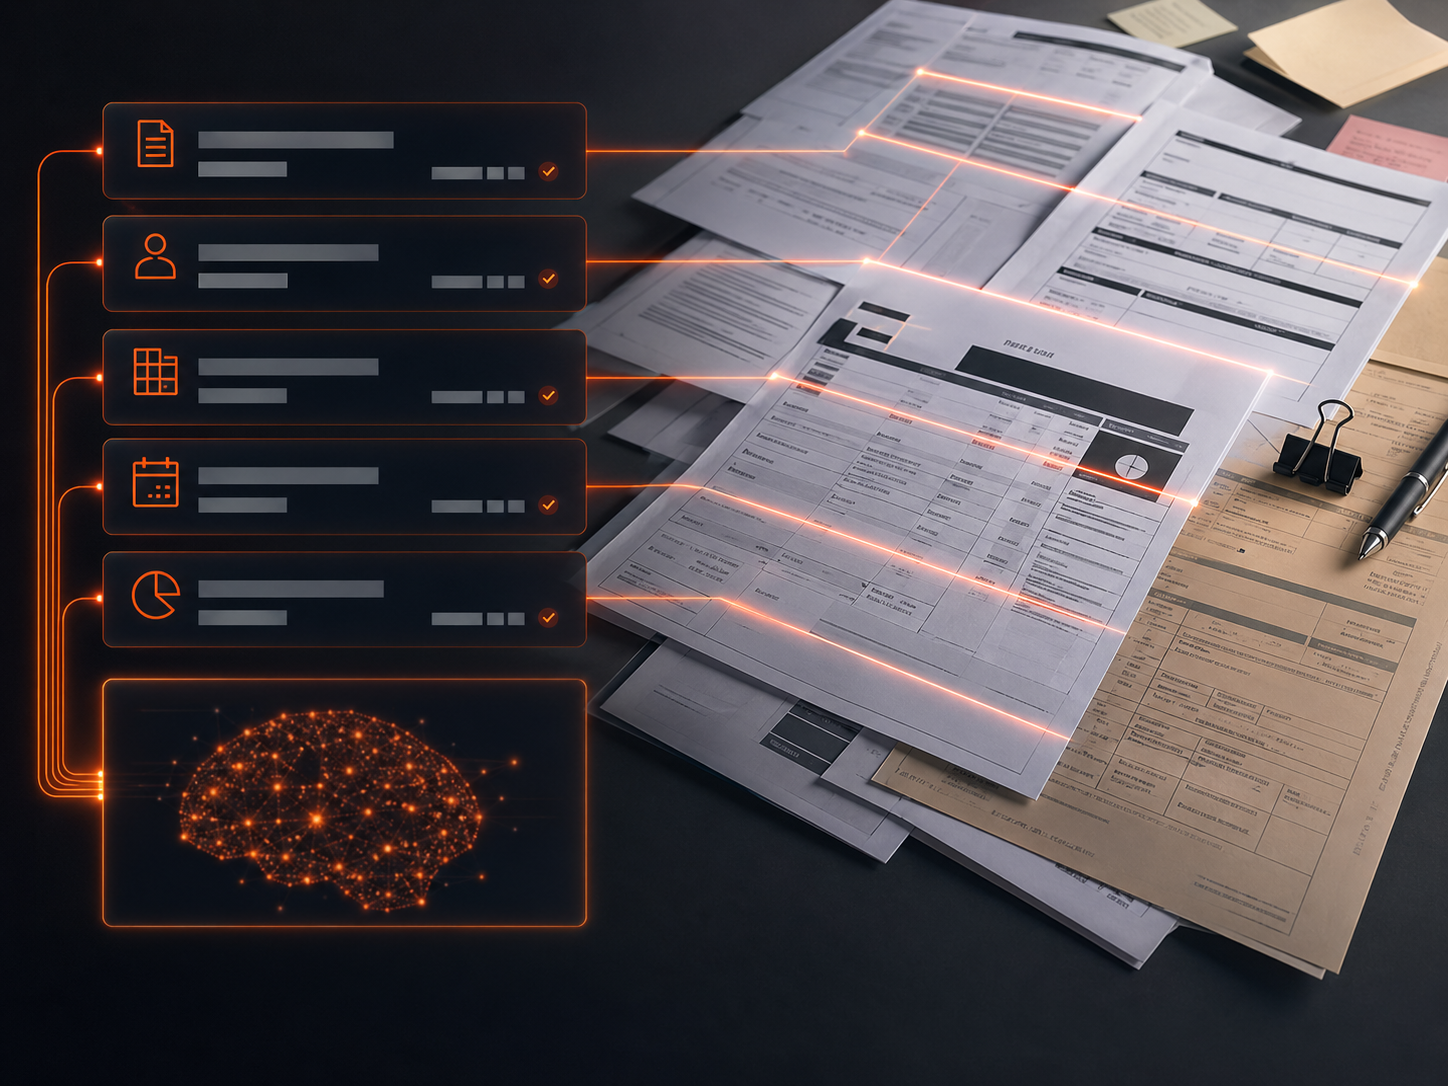
AI Content Rewriter
Content output increased 5x. Organic traffic grew 120% in 6 months.
View Project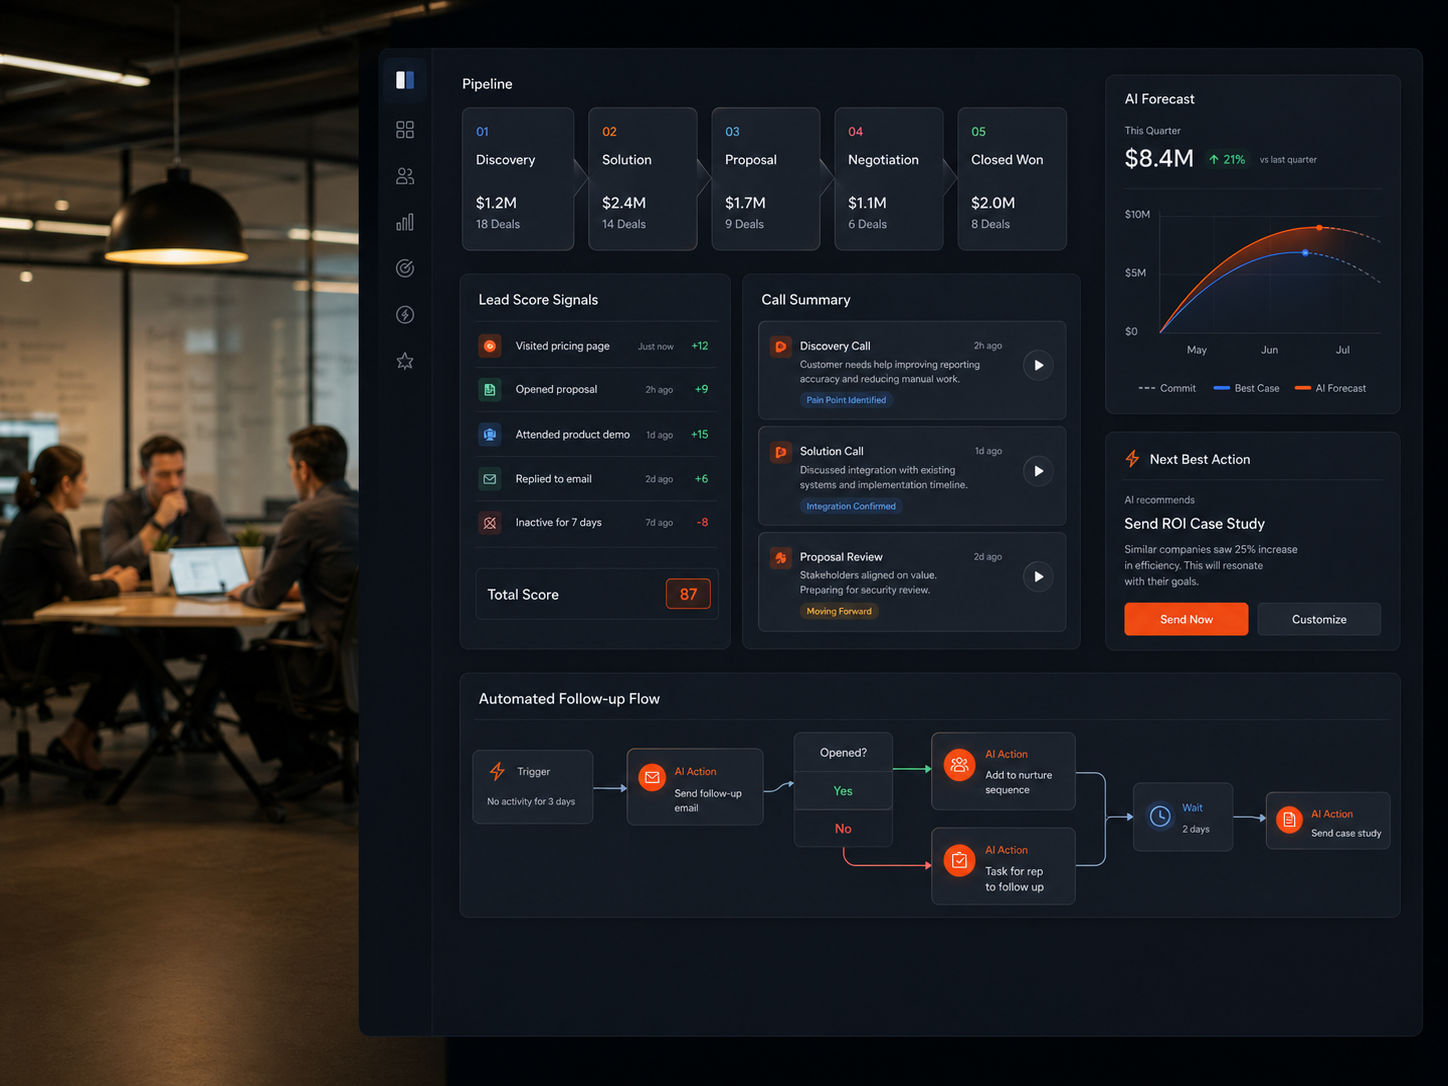
Traffic Analysis Dashboard
Ad spend efficiency improved 55%. ROI visibility went from monthly reports to real-time.
View Project